Simple Chart
The Simple Chart widget offers a clear graphical depiction of the historical price series of a financial instrument without an overwhelming array of technical analysis options. It provides support for three visualization types: line, candles, or mountain. Additionally, users have the flexibility to adjust the aggregation and timeframe, ranging from 1 minute to 5 years, catering to various analytical needs and preferences.
Features
- Different visualization types (candles, mountain, line, volume, baseline).
- Wide chart range support - 1D, 1W, 1M, 6M, YtD, 1Y, 5Y, ALL.
- Wide aggregation period support from 1 minute to 1 month.
- Integrated Symbol Search.
- Snapshot of current data in CSV format.
Showcases
Selected symbol
Main widget view with a selected symbol.
Line chart type

Candle chart type

Mountain chart type
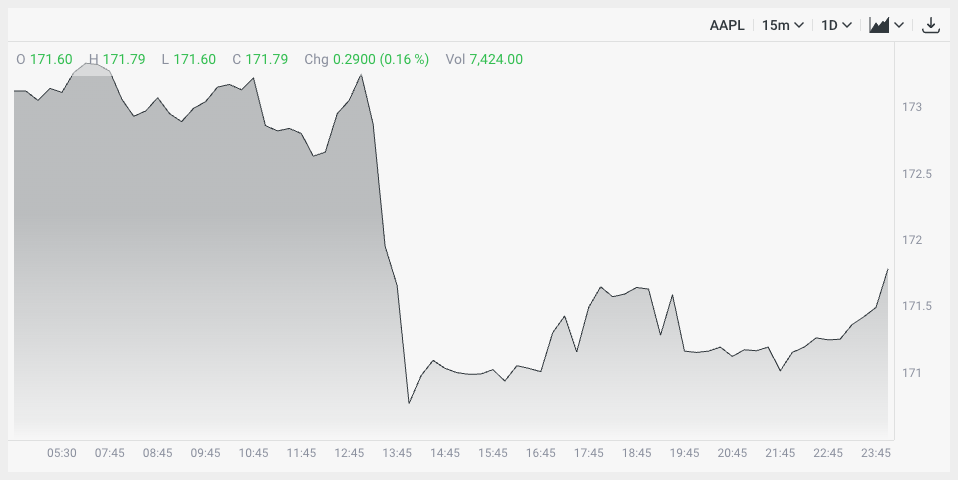
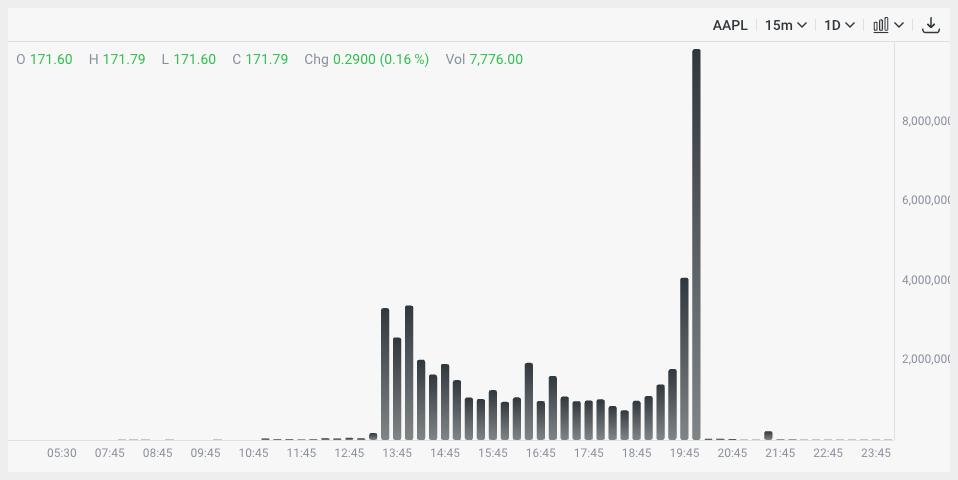
Volume chart type
Baseline chart type

Unspecified symbol
If no symbol is specified, the widget will display its initial state.

Dark mode
By default, widgets support dark and light themes, though it's also possible to create a custom theme.

Setup
Installation
The widget is distributed both via a CDN and as an NPM package.
- npm
- Yarn
- pnpm
- Bun
npm i @dx-display/widgets-simple-chart
yarn add @dx-display/widgets-simple-chart
pnpm add @dx-display/widgets-simple-chart
bun add @dx-display/widgets-simple-chart
CDN Link: https://path-to-cdn/widgets/simple-chart.js
Refer to this guide for instructions on utilizing our CDN bundle.
Configure DataProviders
The Simple Chart widget requires you to have access the following dxFeed Data Providers:
const dataProviders = {
  ipfPath: '/your-path/ipf',
  ipfAuthHeader: 'your-header',
  feedPath: 'wss://your-path/feed',
  feedAuthHeader: 'your-header',
  schedulePath: '/api/schedule',
}
If you don't have access to these data providers, please contact dxFeed team.
Code example
Below, you'll find a code example demonstrating widget integration, utilizing only the essential parameters. Refer to the widget API section for comprehensive details on all available options.
Show code!
import { newSimpleChartWidget } from '@dx-display/widgets-simple-chart'

const dataProviders = {
  ipfPath: '/your-path/ipf',
  ipfAuthHeader: 'your-header',
  feedPath: 'wss://your-path/feed',
  feedAuthHeader: 'your-header',
  schedulePath: '/api/schedule',
}
// make sure that next element exist in your DOM
const container = document.getElementById('widget')
container.style.height = '600px'
container.style.width = '800px'

const widget = newSimpleChartWidget({
  element: container,
  providers: dataProviders,
})
Configurator
API
Please refer to the links below for a comprehensive list of all parameters available for the described widget.