Option Charts
The Option Charts widget provides a visualization of both the individual options and the dynamic of the whole series.
Features
- Multiple option metrics: 'volatility', 'delta', 'gamma', 'vega', 'theta', 'rho', 'theoPrice'.
- Supports strike or delta for selected option metric.
- Allows to view call or put side of option.
- Different presentation of option expiration like date, tenor days, tenor years.
- Ability to switch the visibility of individual series.
- Integrated Symbol Search.
Showcases
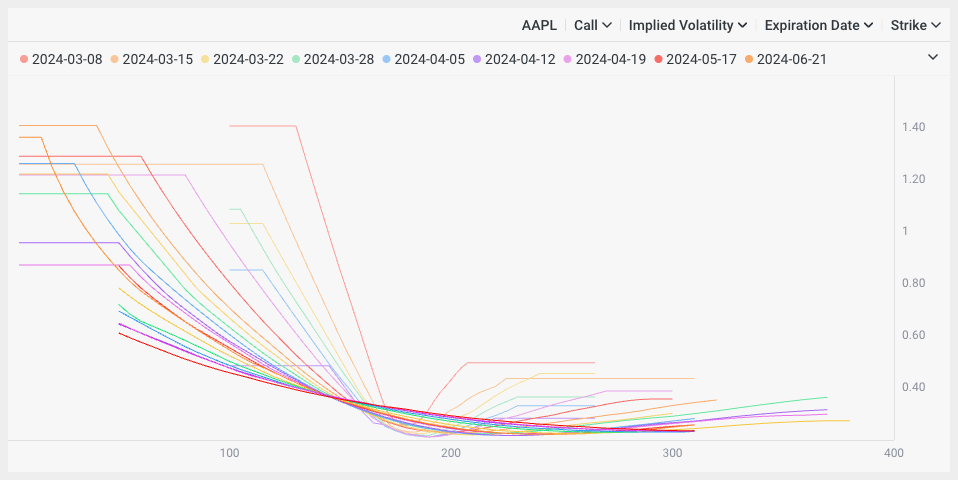
Selected symbol
Main widget view with a selected symbol.
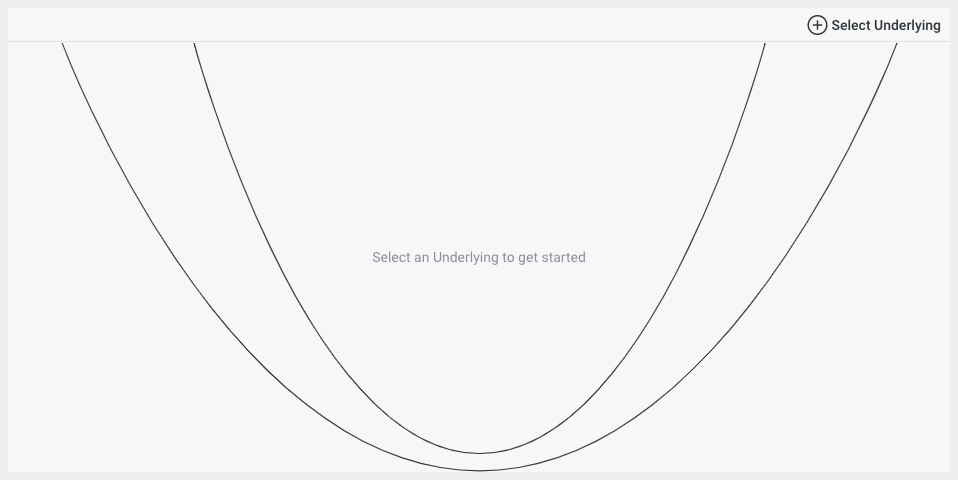
Unspecified symbol
If no symbol is specified, the widget will display its initial state.
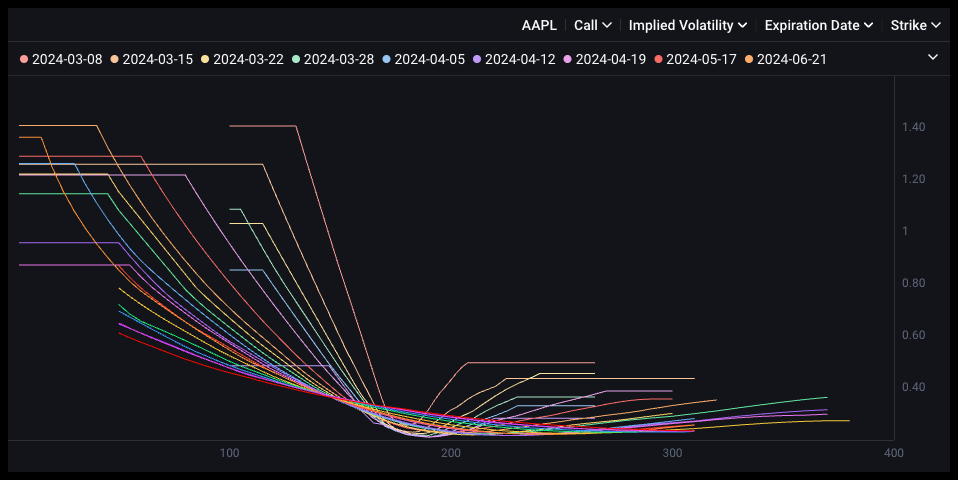
Dark mode
By default, widgets support dark and light themes, though it's also possible to create a custom theme.
Setup
Installation
The widget is distributed both via a CDN and as an NPM package.
- npm
- Yarn
- pnpm
- Bun
npm i @dx-display/widgets-option-charts
yarn add @dx-display/widgets-option-charts
pnpm add @dx-display/widgets-option-charts
bun add @dx-display/widgets-option-charts
CDN Link: https://path-to-cdn/widgets/option-charts.js
Refer to this guide for instructions on utilizing our CDN bundle.
Configure DataProviders
The Option Charts widget requires you to have access the following dxFeed Data Providers:
const dataProviders = {
  ipfPath: '/your-path/ipf',
  ipfAuthHeader: 'your-header',
  feedPath: 'wss://your-path/feed',
  feedAuthHeader: 'your-header',
  schedulePath: '/api/schedule',
}
If you don't have access to these data providers, please contact dxFeed team.
Code example
Below, you'll find a code example demonstrating widget integration, utilizing only the essential parameters. Refer to the widget API section for comprehensive details on all available options.
Show code!
import { newOptionChartsWidget } from '@dx-display/widgets-option-charts'

const dataProviders = {
  ipfPath: '/your-path/ipf',
  ipfAuthHeader: 'your-header',
  feedPath: 'wss://your-path/feed',
  feedAuthHeader: 'your-header',
  schedulePath: '/api/schedule',
}
// make sure that next element exist in your DOM
const container = document.getElementById('widget')
container.style.height = '600px'
container.style.width = '800px'

const widget = newOptionChartsWidget({
  element: container,
  providers: dataProviders,
})
Configurator
API
Please refer to the links below for a comprehensive list of all parameters available for the described widget.