Advanced Chart
The Advanced Chart widget is a robust charting package designed for comprehensive technical analysis and efficient trading, suitable for both day and swing traders.
Features
- 100+ technical indicators.
- Wide selection of drawings.
- Various chart types.
- Multiple charts layout.
- Price scale configuration.
- Custom aggregation periods and presets.
- Integrated Symbol Search.
Showcases
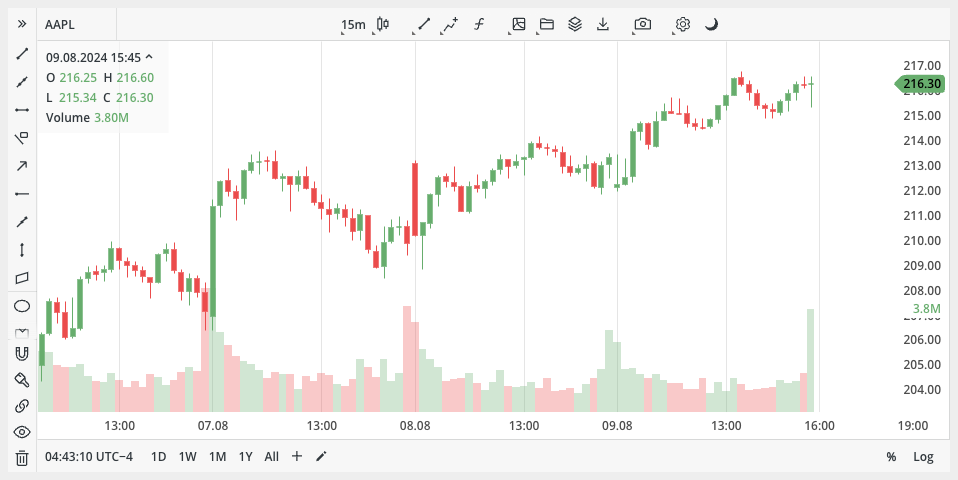
Selected symbol
Main widget view with a selected symbol.
Unspecified symbol
If no symbol is specified, the widget will display its initial state.

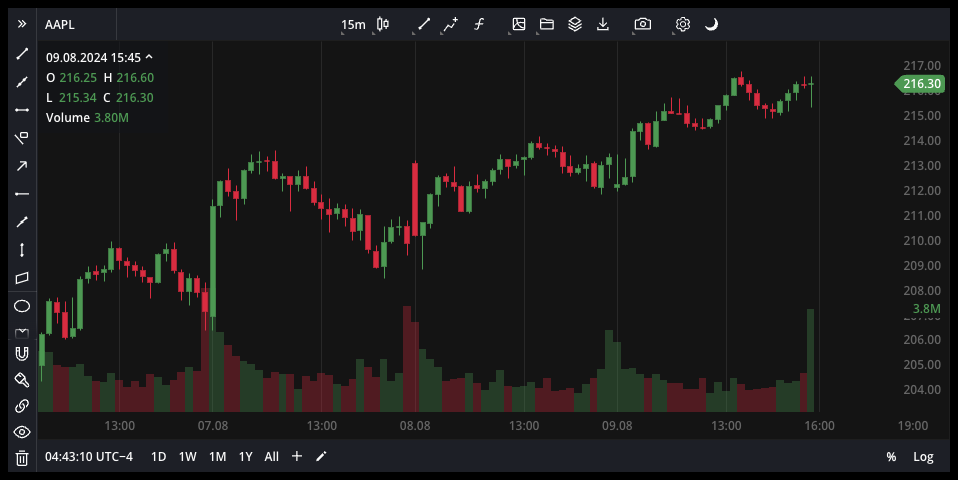
Dark mode
By default, widgets support dark and light themes, though it's also possible to create a custom theme.
Setup
Installation
The widget is distributed both via a CDN and as an NPM package.
- npm
- Yarn
- pnpm
- Bun
npm i @dx-display/widgets-advanced-chart
yarn add @dx-display/widgets-advanced-chart
pnpm add @dx-display/widgets-advanced-chart
bun add @dx-display/widgets-advanced-chart
CDN Link: https://path-to-cdn/widgets/advanced-chart.js
Refer to this guide for instructions on utilizing our CDN bundle.
Configure DataProviders
The advanced-chart widget can be easily connected to dxFeed data services or to your own data services with your implementation of our provider.
Use dxfeed data services
To be able to connect to dxFeed data services you need to have access to the following dxFeed Data Providers:
If you don't have access to these data providers, please contact dxFeed team.
Below, you'll find a code example demonstrating widget integration, utilizing only the essential parameters. Refer to the widget API section for comprehensive details on all available options.
Show code!
import { newAdvancedChartWidget } from '@dx-display/widgets-advanced-chart'

const dataProviders = {
  ipfPath: '/your-path/ipf',
  ipfAuthHeader: 'your-header',
  feedPath: 'wss://your-path/feed',
  feedAuthHeader: 'your-header',
  schedulePath: '/api/schedule',
}
// make sure that next element exist in your DOM
const container = document.getElementById('widget')
container.style.height = '600px'
container.style.width = '800px'

const widget = newAdvancedChartWidget({
  element: container,
  providers: dataProviders,
})
Connect you own data services
To connect the widget with your data you need to implement a special interface and pass it to the widget.
The code demonstrating widget integration, utilizing only the essential parameters. Refer to the widget API section for comprehensive details on all available options.
Show code!
import { newAdvancedChartWidget } from '@dx-display/widgets-advanced-chart'

const customDataProviders = {
  dataService: {
    getHistoryCandles(symbol, aggregation, period, options, overrideCandles) {
      // your implementation
    },
    subscribeLastCandleUpdates(symbol, aggregation, options, callback) {
      // your implementation
    },
    subscribeSummary(symbol, callback) {
      // your implementation
    },
    subscribeQuote(symbol, callback) {
      // your implementation
    },
    getTradingSessions(symbol, period) {
      // your implementation
    },
    searchInstrument(search) {
      // your implementation
    },
    getInstrumentData(symbol) {
      // your implementation
    },
  },
}
// make sure that next element exist in your DOM
const container = document.getElementById('widget')
container.style.height = '600px'
container.style.width = '800px'

const widget = newAdvancedChartWidget({
  element: container,
  providers: dataProviders,
})
Configurator
API
Please refer to the links below for a comprehensive list of all parameters available for the described widget.